Astronomy has always been a “big data science”. Astronomy is an observational science: we just have to wait, watch, see and interpret what happens somewhere on the sky. We can’t control it, we can’t plan it, we can just observe in any kind of radiation imaginable and hope that we understand enough of the physics that governs the celestial objects to make sense of it. In recent years, more and more tools that are so very common in the world of data science have also penetrated the field of astrophysics. Where observational astronomy has largely been a hypothesis driven field, data driven “serendipitous” discoveries have become more commonplace in the last decade, and in fact entire surveys and instruments are now designed to be mostly effective through statistics, rather than through technology (even though it is still stat of the art!).
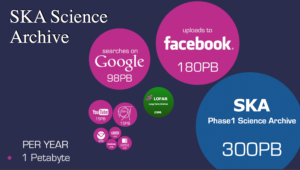
In order to illustrate how astronomy is leading the revolutions in data streams, this infographic was used by the organizers of a hackathon I went to nearing the end of April:

The Square Kilometer Array will be a gigantic radio telescope that is going to result in a humongous 160 TB/s rate of data coming out of antennas. This needs to be managed and analysed on the fly somehow. At ASTRON a hackathon was organized to bring together a few dozen people from academia and industry to work on projects that can prepare astronomers for the immense data rates they will face in just a few years.
As usual, and for the better, smaller working groups split up and started working on different projects. Very different projects, in fact. Here, I will focus on the one I have worked on, but by searching for the right hash tag on twitter, I’m sure you can find info on many more of them!
We jumped on two large public data sets on galaxies and AGN (Active Galactic Nuclei: galaxies with a supermassive black hole in the center that is actively growing). One of them was a very large data set with millions of galaxies, but not very many properties of every galaxy (from SDSS), the other, out of which the coolest result (in my own, not very humble opinion) was distilled was from the ZFOURGE survey. In that data set, there are “only” just under 400k galaxies, but there were very many properties known, such as brightnesses through 39 filters, derived properties such as the total mass in stars in them, the rate at which stars were formed, as well as an indicator whether or not the galaxies have an active nucleus, as determined from their properties in X-rays, radio, or infrared.
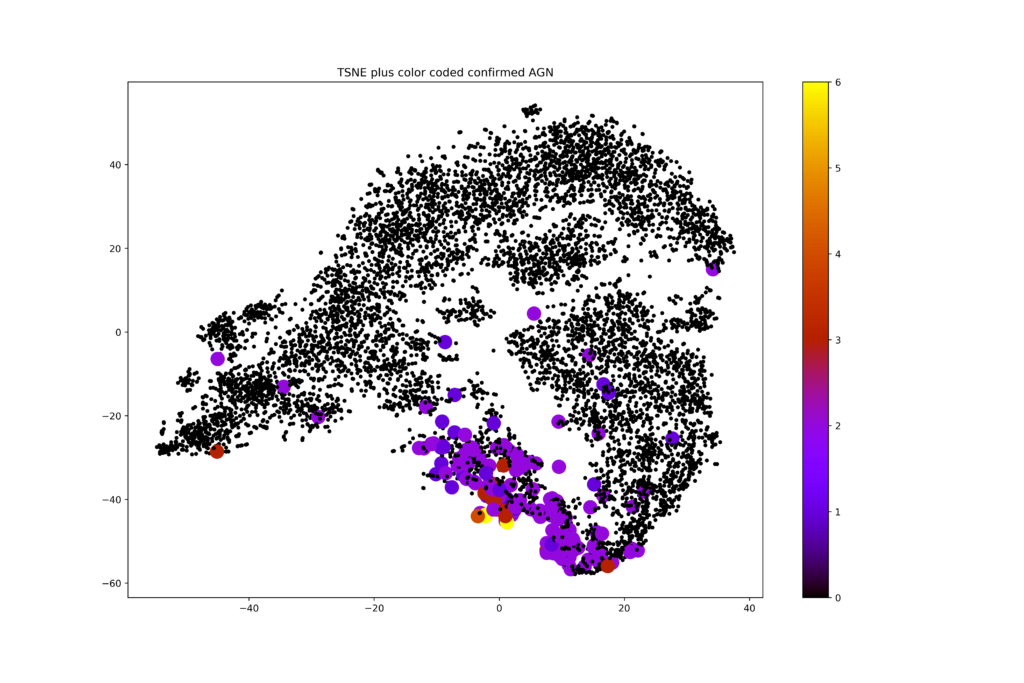
I decided to try something simple and take the full photometric set of columns, so the brightness of the objects in many many wavelengths as well as a measure of their distance to us into account and do some unsupervised machine learning on that data set. The data set had 45 dimensions, so an obvious first choice was to do some dimensionality reduction on it. I played with PCA and my favorite bit of magic: t-SNE. A dimensionality reduction algorithm like that is supposed to reveal if any substructure in the data is present. In short, it tends to conserve local structure and screw up global structure just enough to give a rather clear representation of any clumping in the original high dimensional data set, in two dimensions (or more, if you want, but two is easiest to visualize). I made this plot without putting in any knowledge about which galaxies are AGN, but colored the AGNs and made them a bit bigger, just to see where they would end up:

To me, it was absolutely astonishing to see how that simple first try came up with something that seems too good to be true. The AGN cluster within clumps that were identified without any knowledge of the galaxies having an active nucleus or not. Many galaxies in there are not classified as AGN. Is that because they were simply not observed at the right wavelengths? Or are they observed but would their flux be just below detectable levels? Are the few AGN far away from the rest possible mis-classifications? Enough questions to follow up!
On the fly, we needed to solve some pretty nasty problems in order to get to this point, and that’s exactly what makes these projects so much fun to do. In the data set, there were a lot of null values, no observed flux in some filters. This could either mean that the observatory that was supposed to measure that flux didn’t point in the direction of the objects (yet), or that there was no detected flux above the noise. Working with cells that have no number at all or only upper limits on the brightness in some of the features that were fed to the machine learning algorithm is something most ML models are not very good at. We made some simple approximations and informed guesses about what numbers to impute into the data set. Did that have any influence on the results? Likely! Hard to test though… For me, this has sprung a new investigation on how to deal with ML on data with upper or lower limits on some of the features. I might report on that some time in the future!
The hackathon was a huge success. It is a lot of fun to gather with people with a lot of different backgrounds to just sit together for two days and in fact get to useful results, and interesting questions for follow-up. Many of the projects had either some semi-finished product, or leads into interesting further investigation that wouldn’t fit in two days. All the data is available online and all code is uploaded to github. Open science for the win!